
Genia vs. SEAOC
Validate Genia LFRS against SEAOC canonical example


In our last article, we walked you through our design methodology for lateral force resisting systems (LFRS). The Structural Engineering Association of California (SEAOC) includes a canonical example in the International Building Code (IBC), with particular emphasis on seismic design. Therefore, we’d like to show you a side-by-side comparison between Genia outputs and the SEAOC solutions included in the IBC SEAOC Structural/Seismic Design Manual Vol. 2.
Project Setup
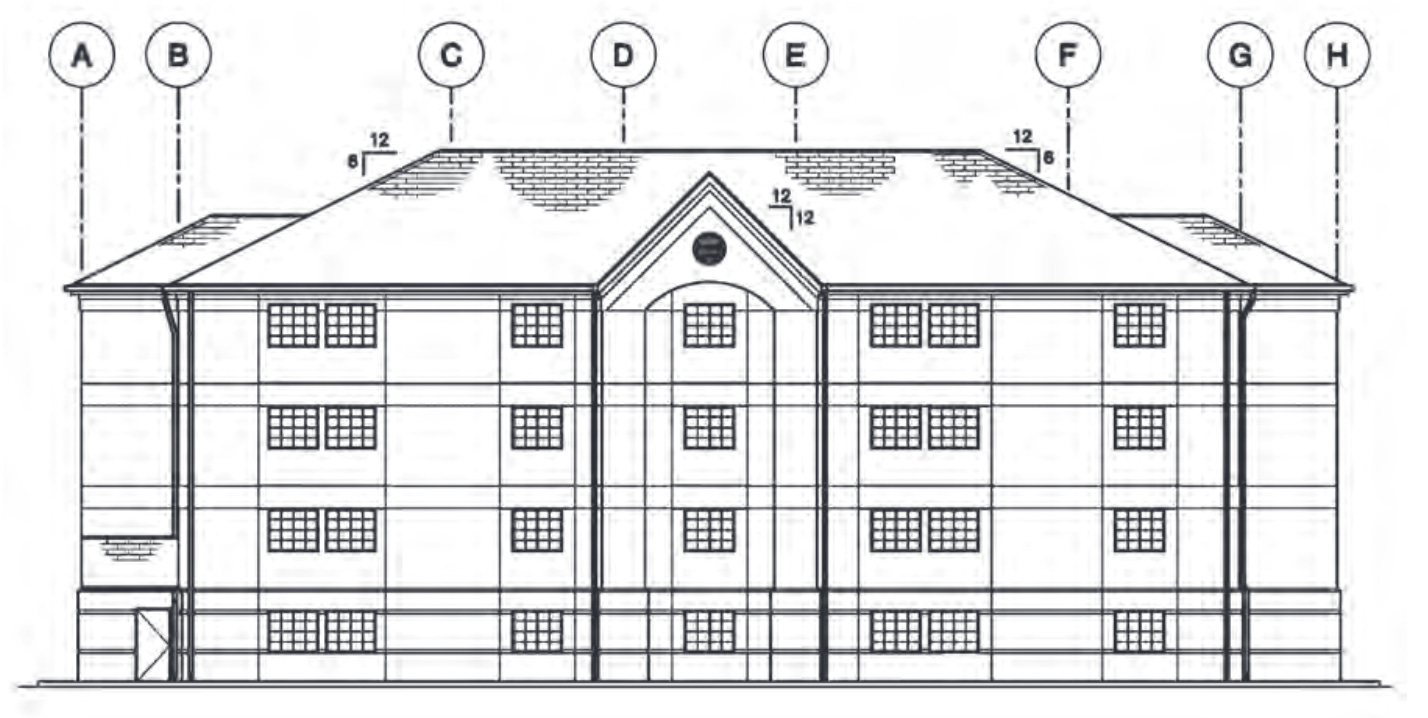
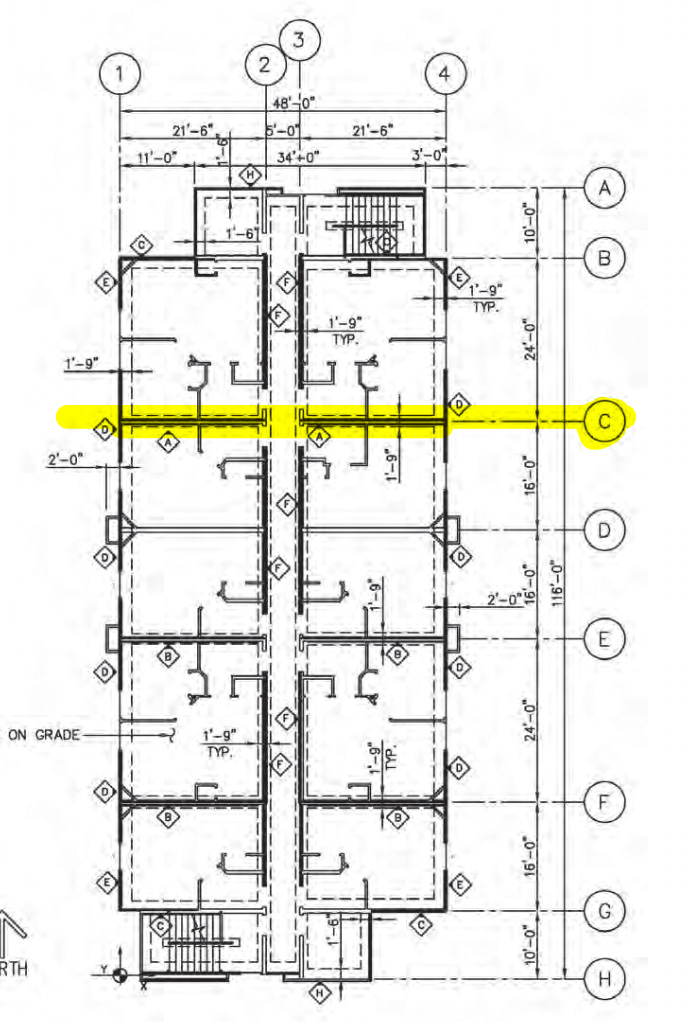
The SEAOC design example is a four-story wood-frame hotel structure assumed to be located in Irvine, CA at Longitude = -117.8320, Latitude = 33.6800, Zip Code 92614. The gravity-load framing system consists of wood-frame bearing walls. The lateral-load resisting system consists of wood-framed bearing shear walls (common box-type system). The building elevation is shown as above.
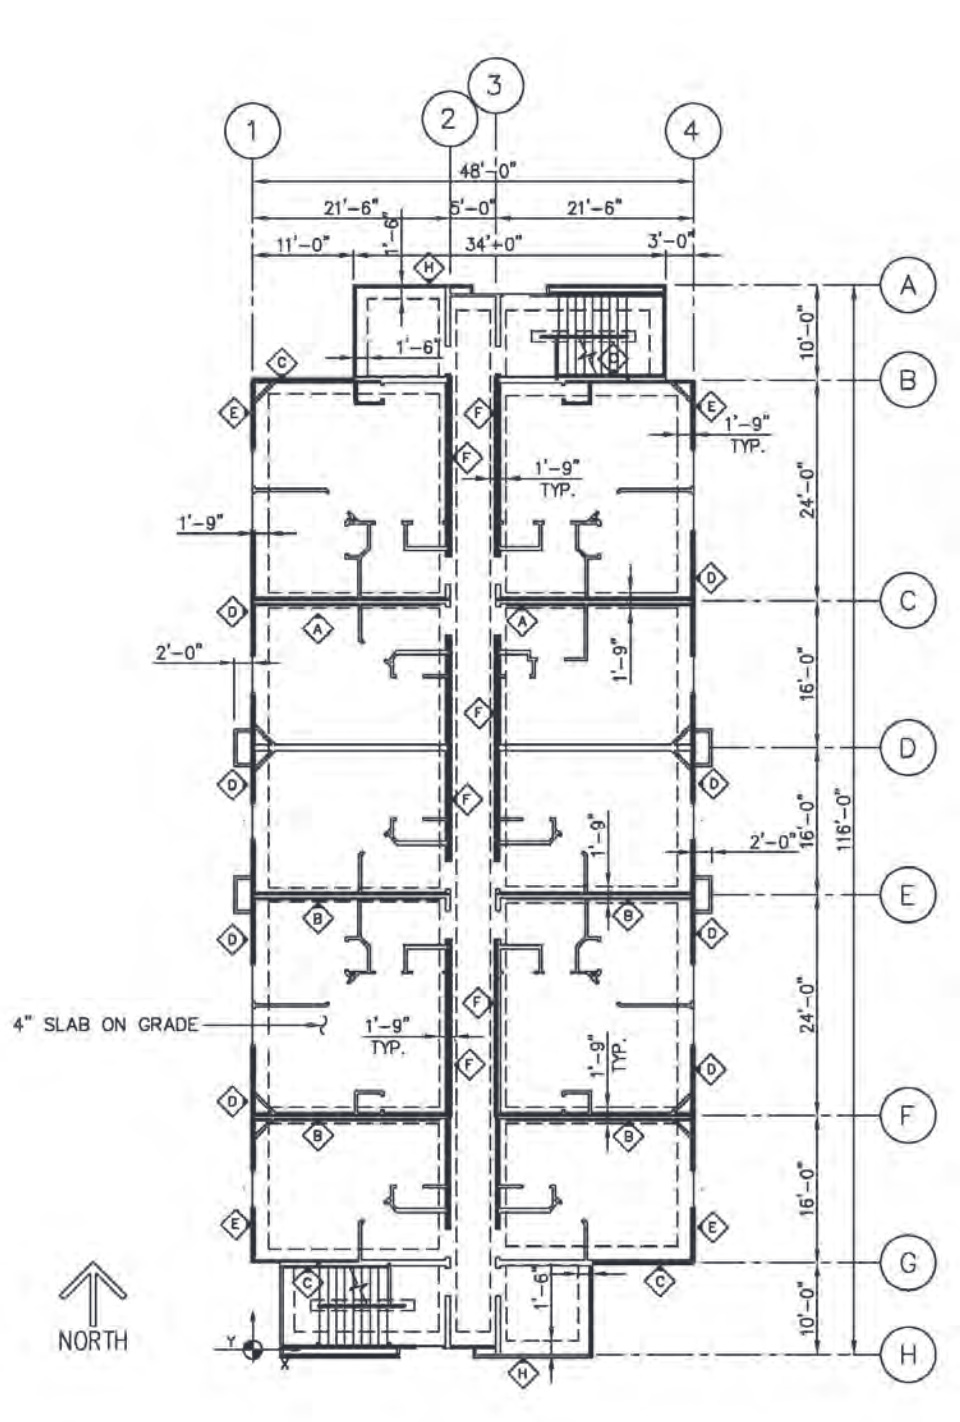
Since the design manual only provides a typical floor layout and the building structure looks the same for every floor from the side view, we make a reasonable assumption that the floor layout is identical across all four stories.

The design manual also provides a roof map with a framing plan. We only use the roof map and do not consider the framing plan when we reconstruct the architecture in CAD. As we follow the steps above, we reconstruct the architecture model from the PDF drawings in AutoCAD here.
Design Results Comparison
As we follow the design steps outlined in the previous article, we have produced the following files for the design example:
We therefore present the following comparison between Genia and SEAOC designs:
1. Base Shear Distribution
In SEAOC manual, the vertical shear distribution across four floors is as following:
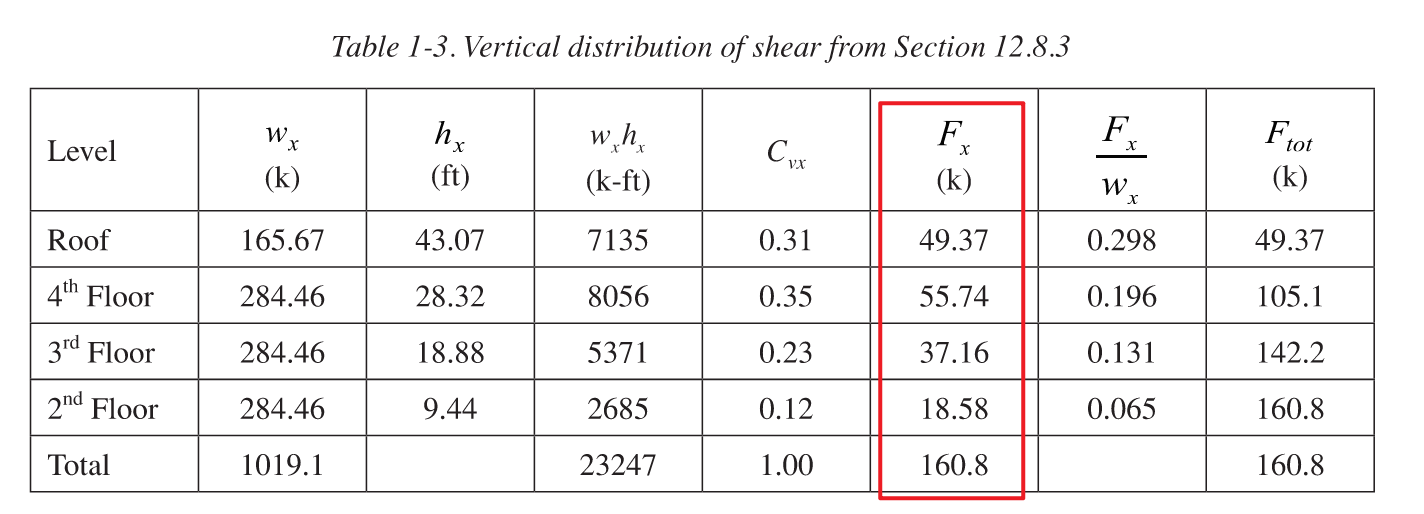
Here is our calculations in Appendix A.6 of our Calculation Sheet:
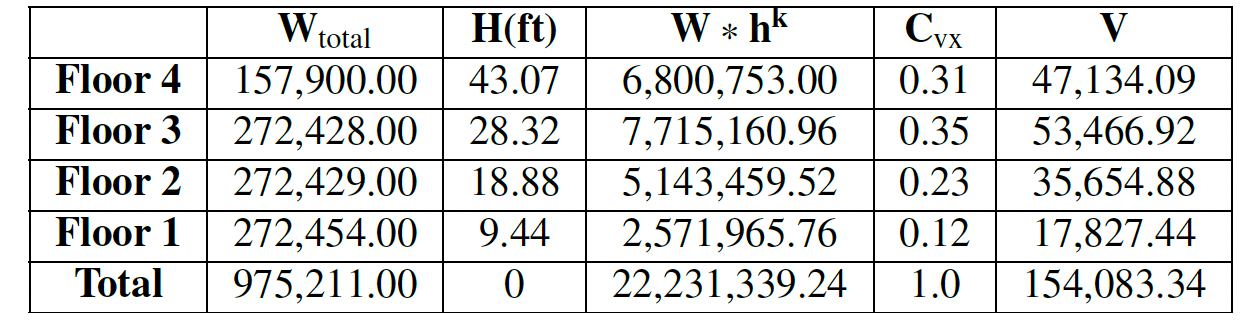
Overall, the difference between Genia and SEAOC calculations is less than 5% for all floors due to differences in floor areas originating from the recreation of the structure in AutoCAD.
2. Vertical Distribution of Base Shear to Shear Band
In SEAOC design, the following shear band/shear line layout is adopted:
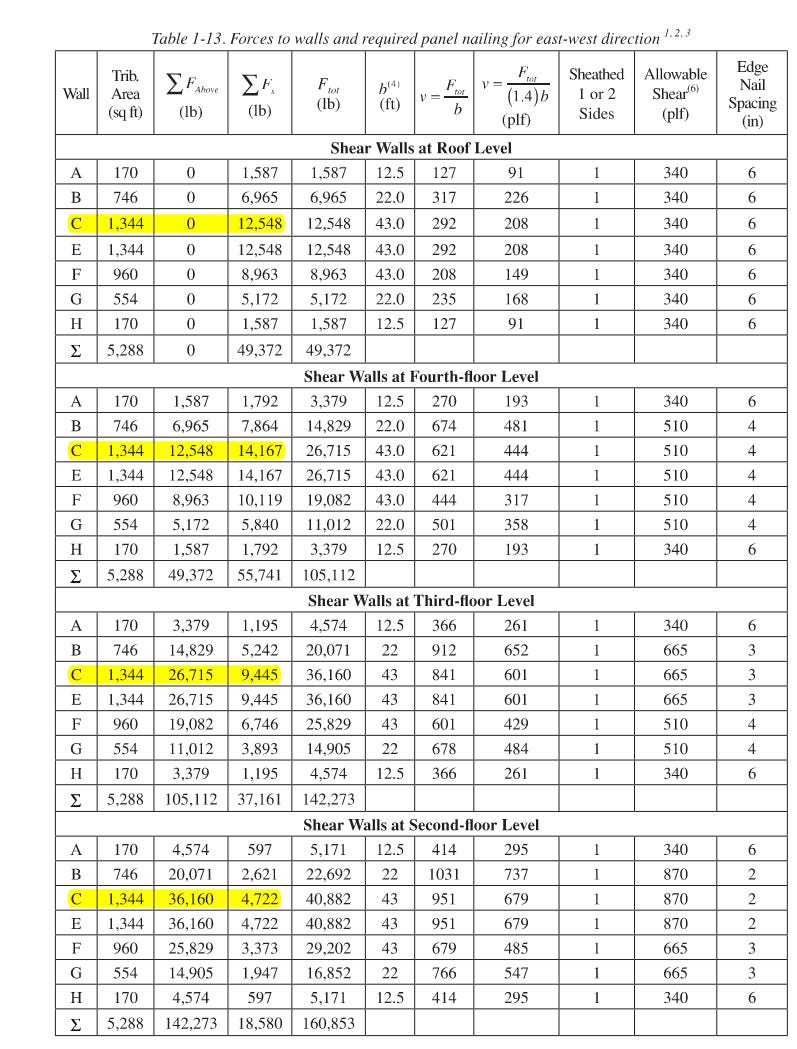
The seismic force distribution results to each shear line is also presented:
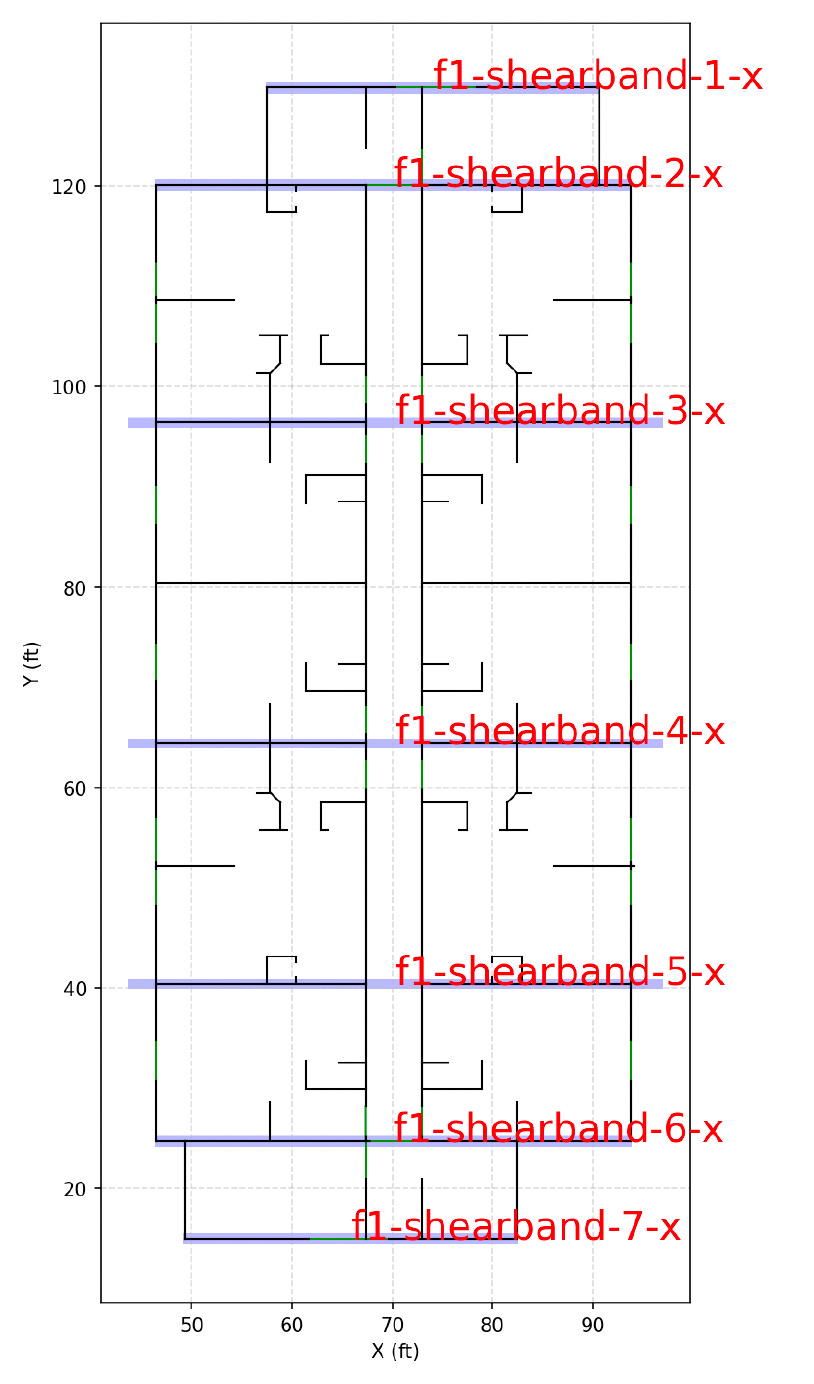
In comparison, Genia’s AI-generated shear line design in East-West direction is identical to SEAOC:
And the calculation results is within 5% difference from SEAOC distributions for the same shear band:
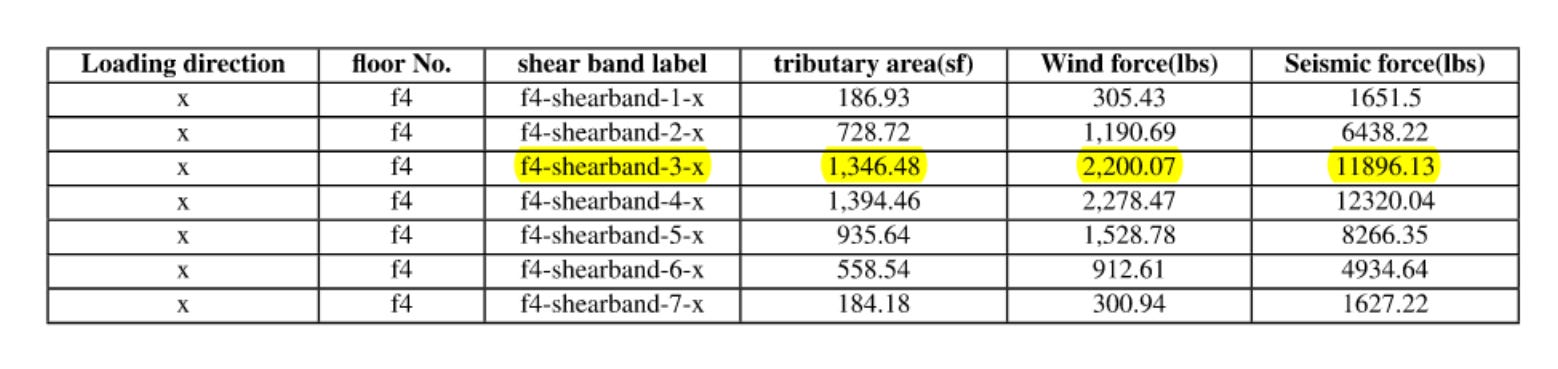
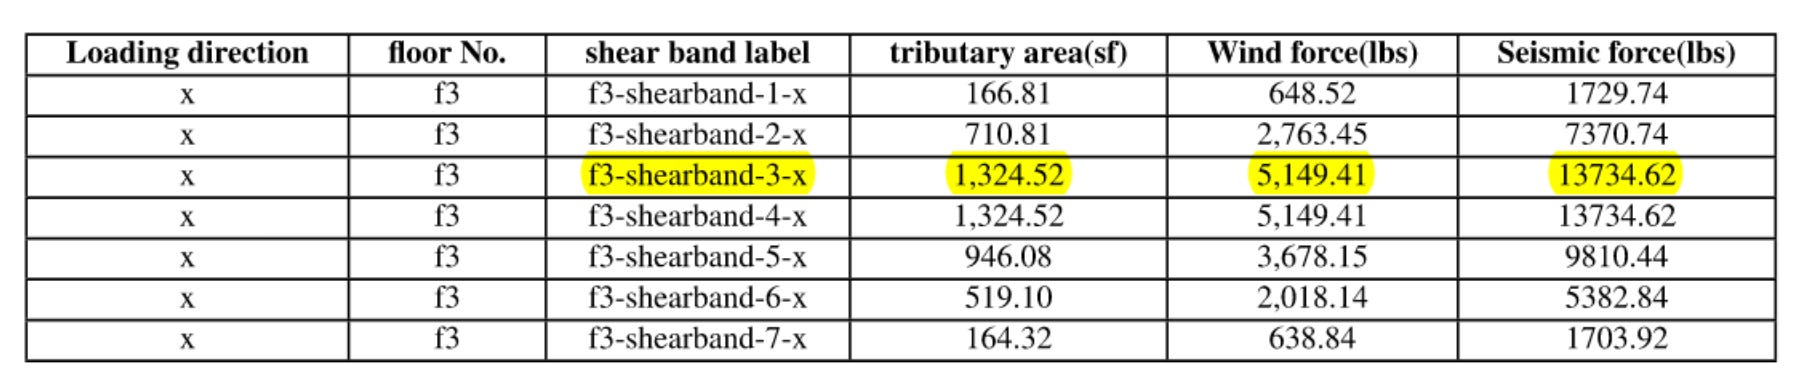
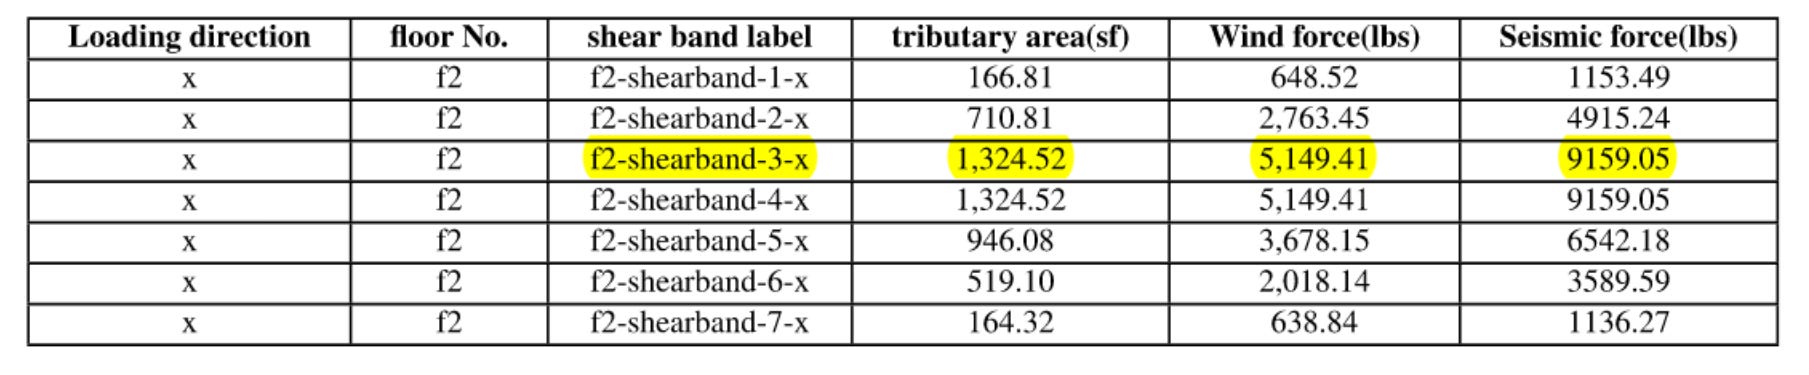
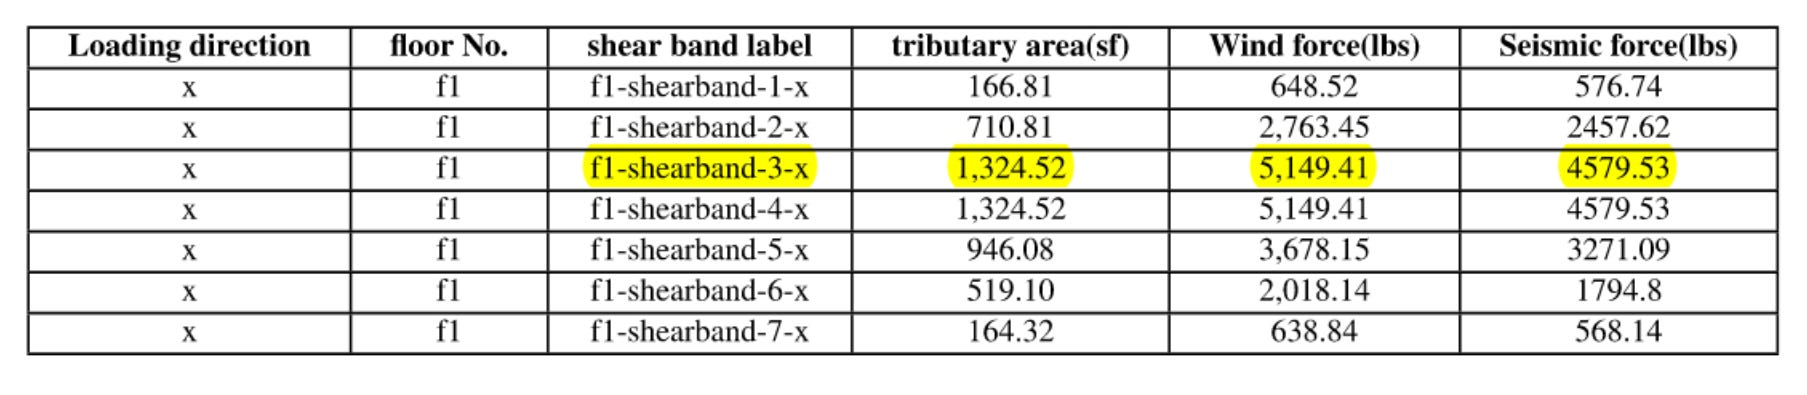
3. Total Seismic Load Distribution to Shear Band, including Influence from Floors Above
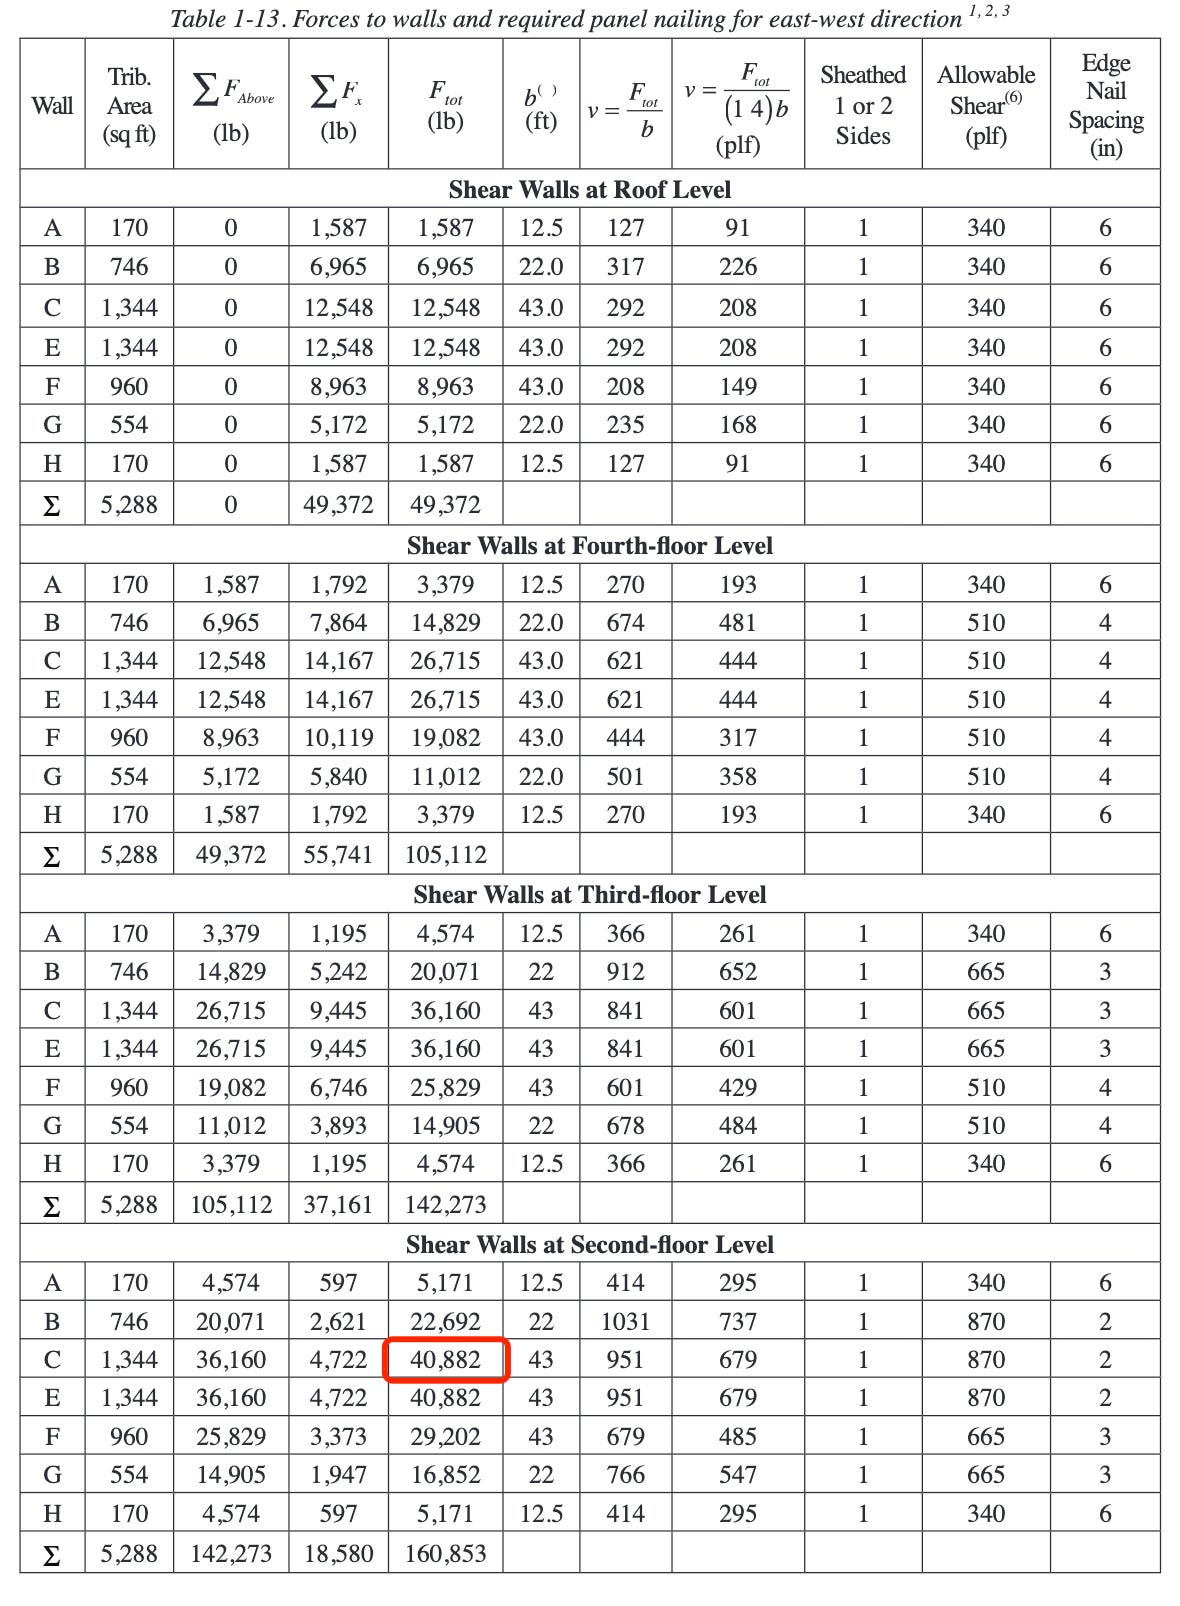
In the same Table 1-13, the total seismic loads distributed to each shear band Ftot include both:
the base shear vertically distributed to each floor and then to each shear band according to its tributary area under the flexible diaphragm assumption, and
the shear forces passed down from the above floors.
For instance, for Shear Band C in the design example, Ftot = 40,882 lbs.
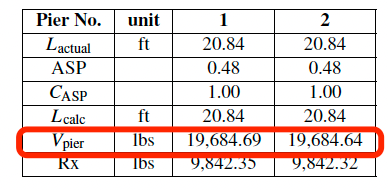
In Genia’s design, the same shear band is labeled as “floor 1-shearband-3-x”. The design details of this shear band is included on page 38 of our Calculation Sheet listed above. “floor 1-shearband-3-x” is made up of two shear piers with their dimensions and forces detailed below:
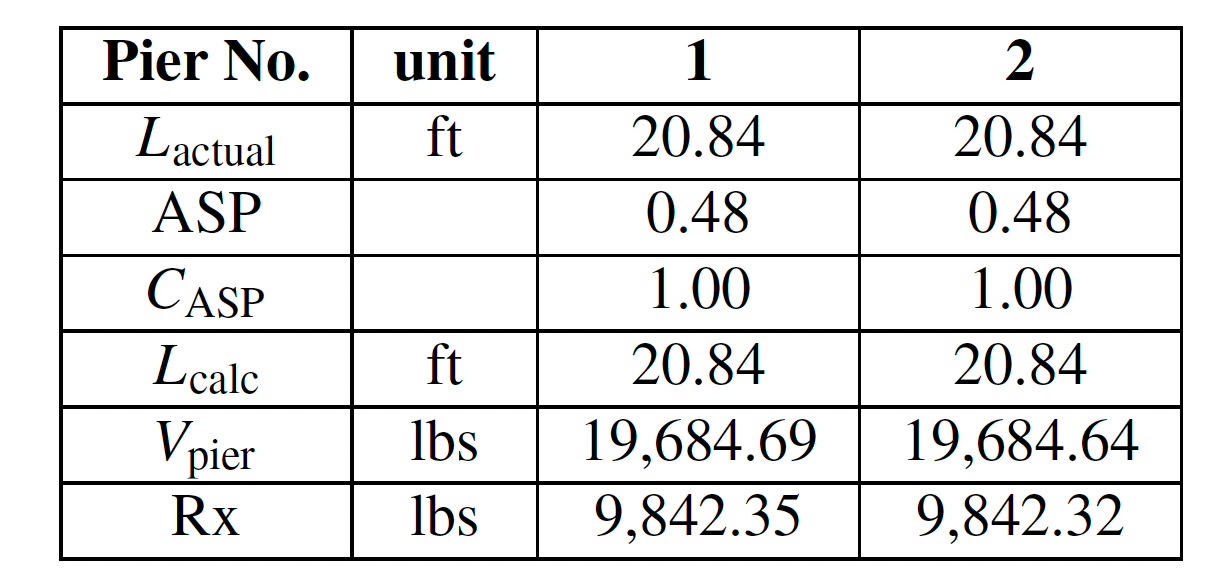
The base shear allocated to this shear pier is 19684.69 + 19684.64 = 39369.33 lbs, which is within 5% difference from the SEAOC design.
4. Seismic Force Distribution to Shear Wall
Now that we have checked the seismic load distributions to each shear band are aligned, we want to further verify the load distribution to each shear wall.
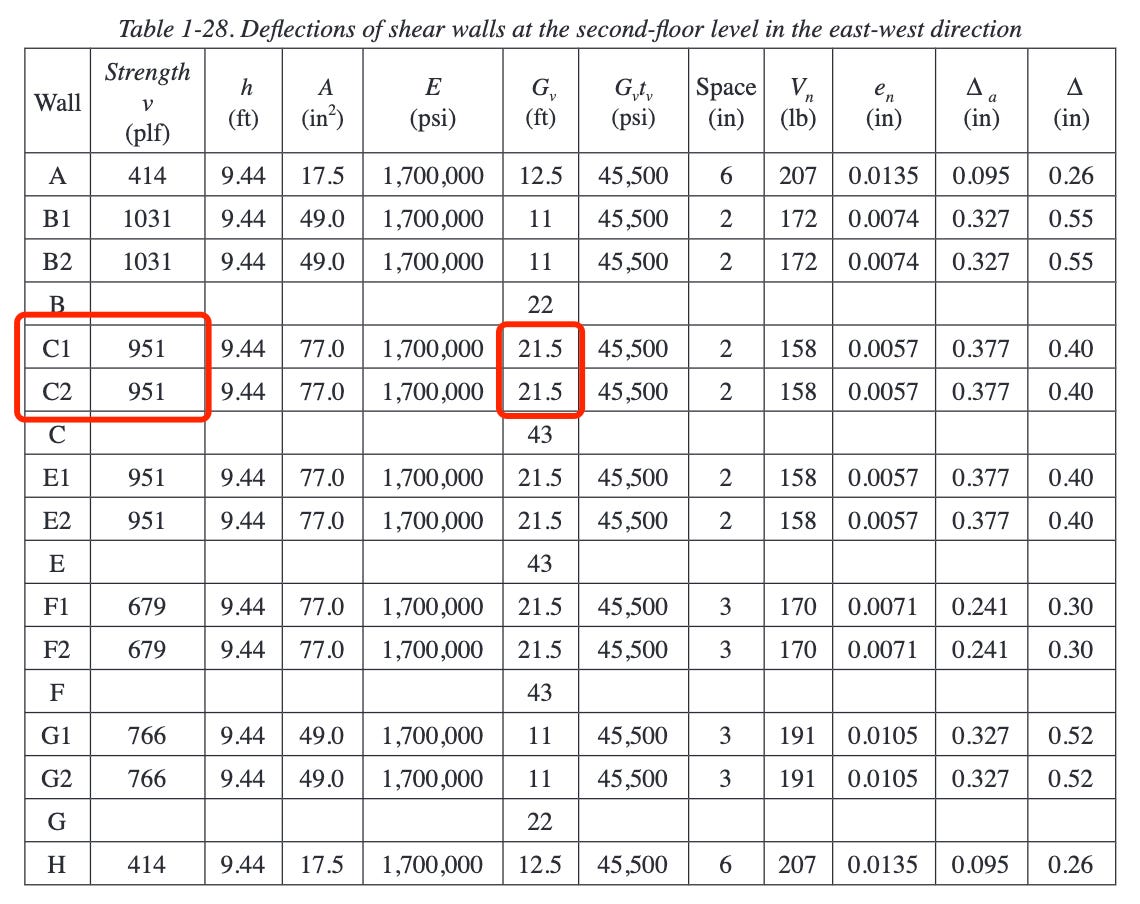
For SEAOC design, each shear wall within shear line C bears 951 × 21.5 = 20446.5 lbs
In Genia design, “f1-shearwall-4” and “f1-shearwall-5” each bears 19684 lbs of lateral forces as we have seen above, which is again within 5% difference from the SEAOC design.
Based on the above analysis, we then proceed to the specific shear wall design. Given the similarity of the shear band layouts and force distributions between Genia and SEAOC’s designs, we therefore expect a similar material specifications of the shear wall. Let’s find out!
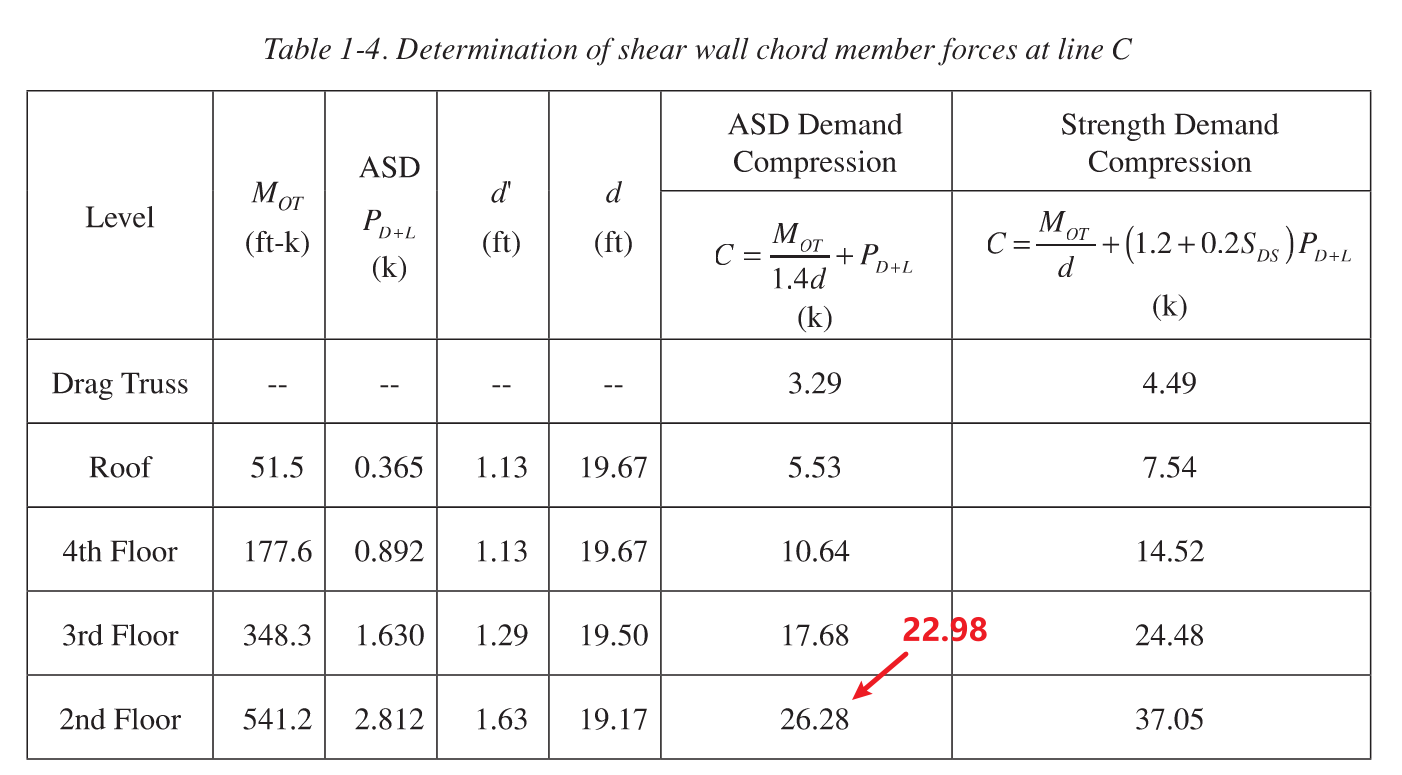
5. Sheathing Design
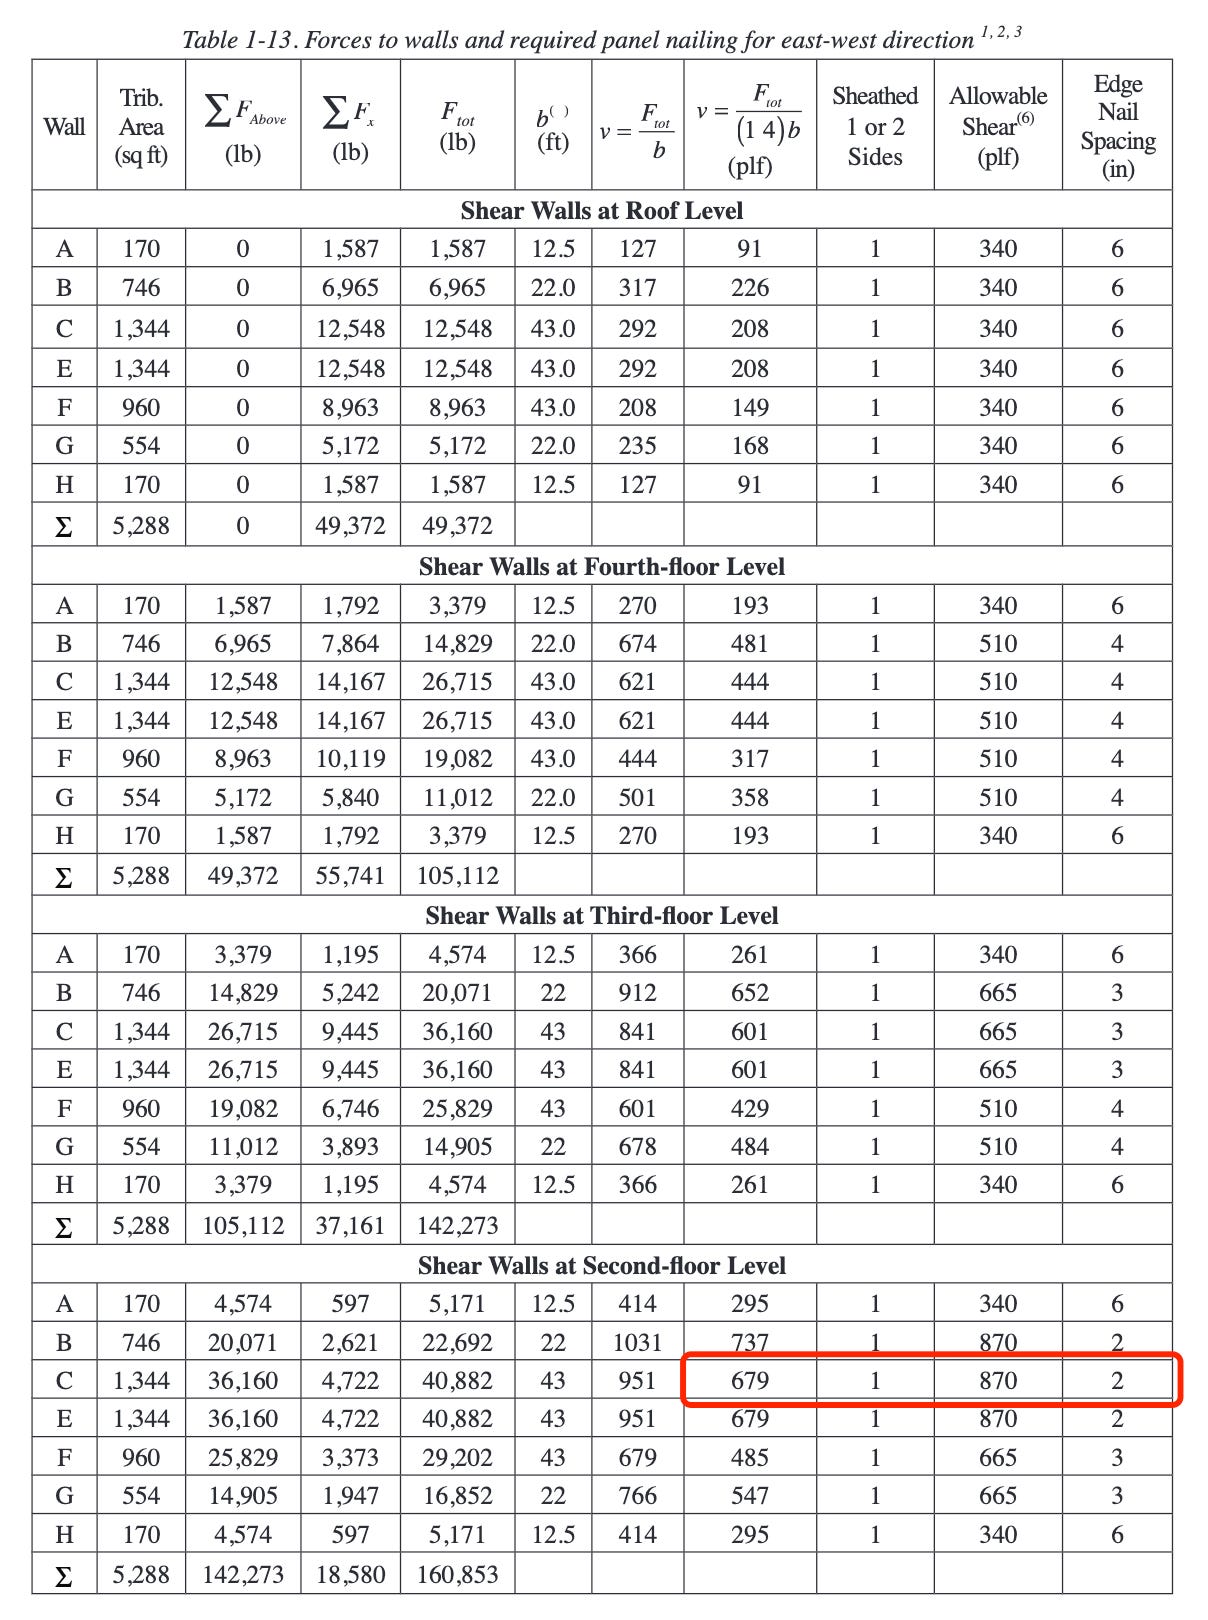
In order to meet the lateral forces detailed above, in SEAOC design, they opt for “S1_15/32_10d@2” following our material notation.
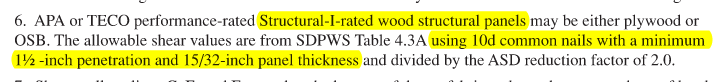
In Genia’s design, we opt for “S1_(2)15/32_10d@6,” which uses double sheathing and has the capacity closest to force demand. We understand that double sheathing might be more difficult to construct, which might explain why the SEAOC design prefers single sheathing with a more compact nailing pattern. When we launch our editor interface in the next release, we can open up this option to the end user and let structural engineers to make the decision.
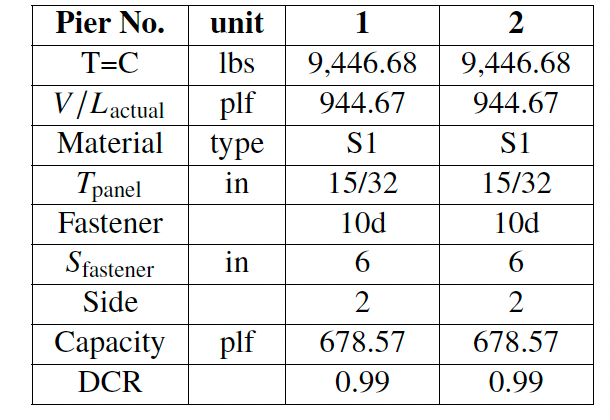
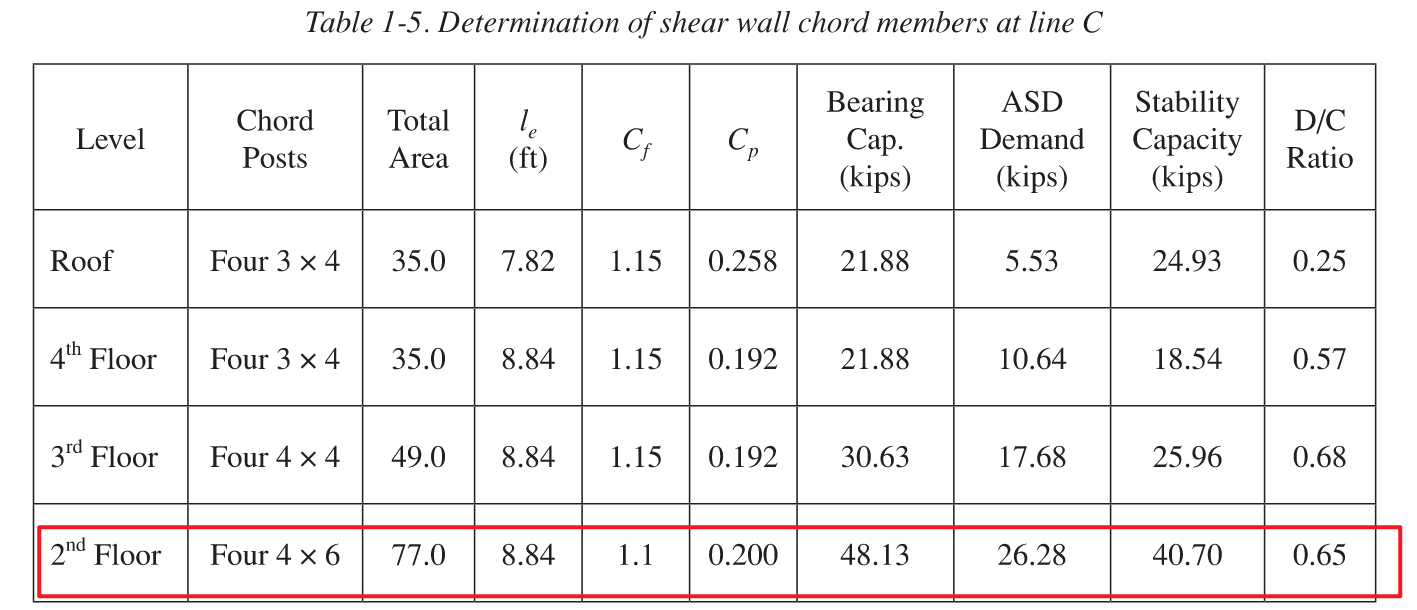
6. Post Design
In the SEAOC design, the post design is derived from the maximum compression. We noticed a calculation error in the ASD Demand Compression, as we follow the formula we should obtain 22.98 instead of 26.28 for the second floor.
Based on the max compression, the SEAOC design recommend the following post design:
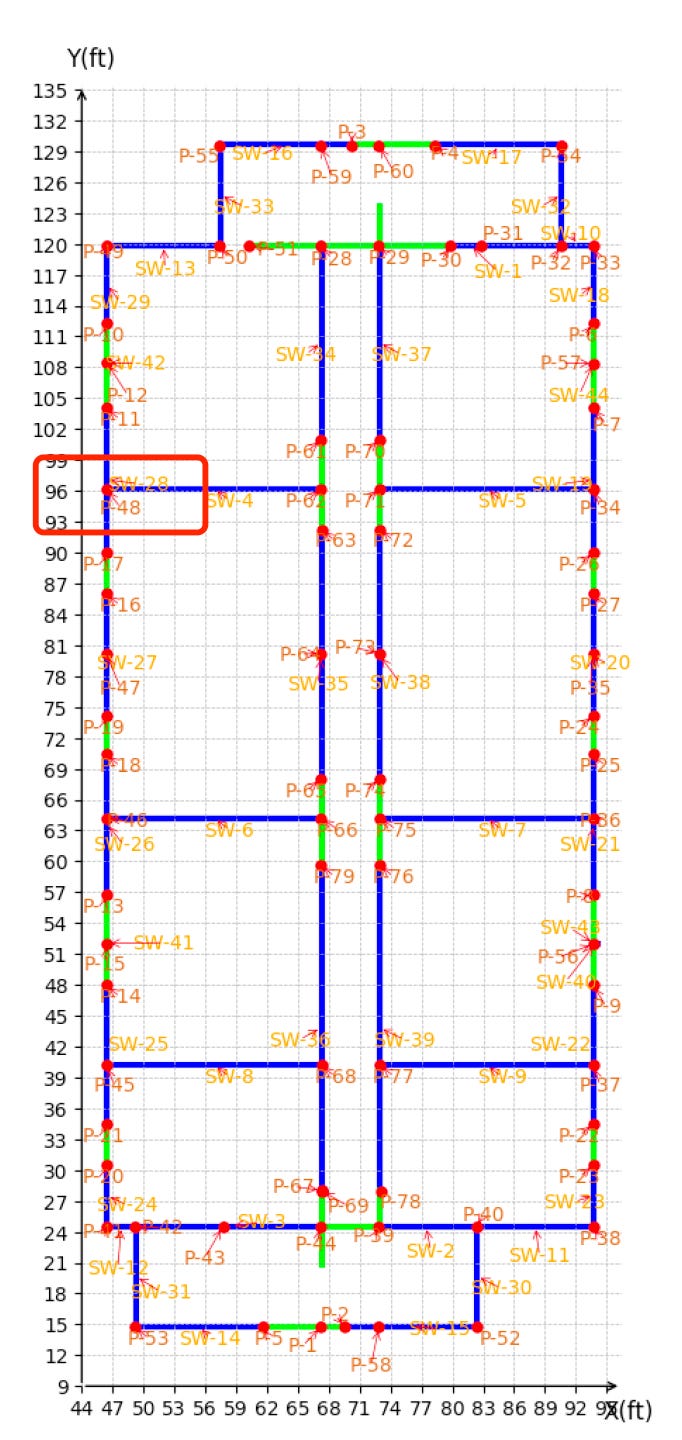
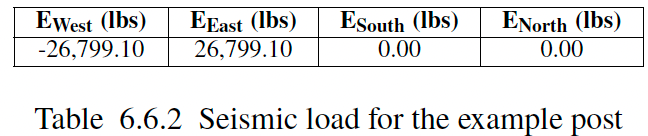
In Genia’s design, we factor loads from both gravity and lateral (wind and seismic). Take the west-most post of the example shear line, i.e. “f1-post-48,” as an example:
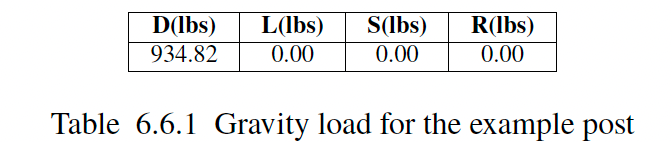
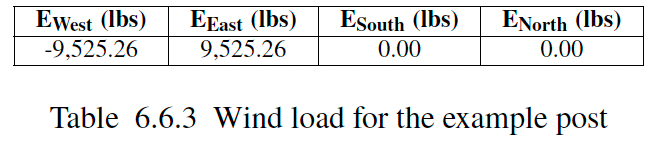
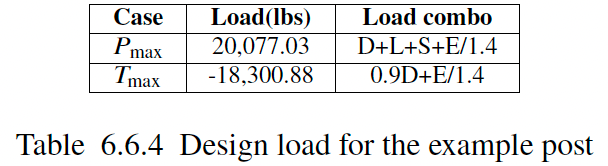
From these loads, we recommend the following post design (the capacity calculations are included in Appendix C of Calculation Sheet):
There are few comments to highlight as there is some difference in the D+L loads between our designs:
When a wall is parallel to a joist, in theory the should also bear some gravity loads from the floor above. Currently, in our model, we are not considering this load passed down from the above and only factoring in the self-weight of the walls.
In the SEAOC design, they use 15 psf when calculating the seismic weight of walls but switch to 10 psf when calculating dead loads without explaining why. We continue using 15 psf in dead loads as well.
When selecting materials from the catalog, we will recommend the post design that has the closest capacity to the demand. We currently do not have a limit on the size dimension of the post.
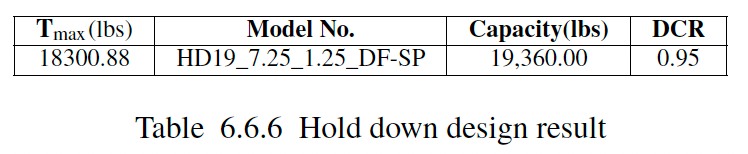
Hold-downs
We further recommend the following hold-down for the post based on the max uplift tension:
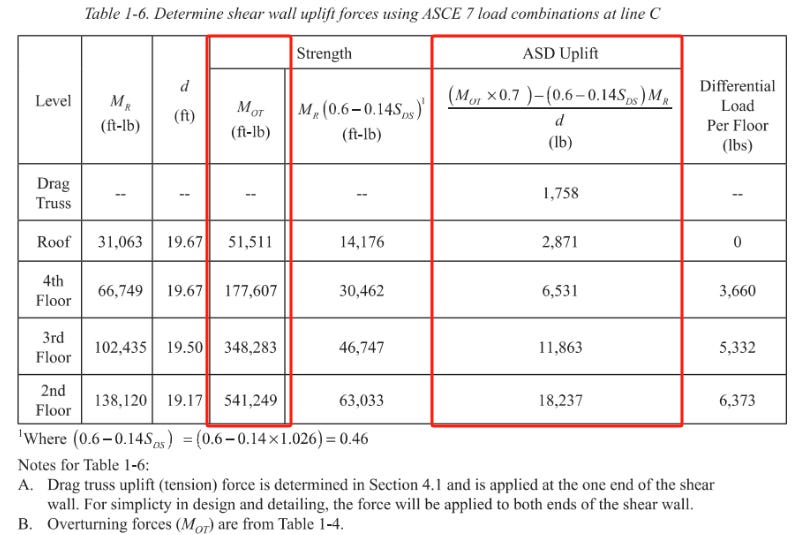
The SEAOC design chooses continuous rod system, so we cannot make a direct comparison here. Below is their calculations of the max uplift tension:
There are two differences that we want to highlight here:
In our calculations, we ignore the effect of MR, i.e. the counter impact of self weight on the overturning moment for two reasons:
We try to stay with a more conservative approach in our calculations.
Wood-framed shear walls have relatively low stiffness.
When considering load combinations, the SEAOC uses MOT × 0.7, and we use MOT / 1.4 = MOT × 0.714, which will cause minor differences.
If we revert the impact of these differences in methods, we will obtain MOT /d = 541,249 / 19.17 = 28,234 lbs following the SEAOC design, which is less than 5% difference from Genia’s value of 26,799 lbs.
Conclusion
In conclusion, by running our Generative Design on a well-recognized design example and provide a side-by-side comparison between our design outcomes, we hope to add more transparency to our AI-led structural design process and convince the professional structural engineering community about the validity behind our design solution.
It is also worth mentioning once again that we only leverage AI’s creativity in structural layout, a process which is heavily dependent on human experiences today. There is not necessarily a right or wrong answer at this stage but based on experience a senior engineer may have a better sense of whether a structural plan has a higher chance to pass structural analysis and is superior in performance and cost.
However, for the actual calculations, we are on the same page as everyone that AI DO make mistakes and our industry is NOT tolerant to mistakes as people’s lives are at stake if our structural design goes wrong. Therefore to ensure quality, we perform structural analysis WITHOUT any AI in the same fashion as the building codes instruct us and as every human engineer would do.
This article was inspired from conversations with a prospect client as he wanted to see our design results comparison against the canonical example in the SEAOC manual. We thought the idea was brilliant and timely as we just covered in detail the lateral design methodology in our last article, so we added this one in the middle of our series. In our next article, we will resume the normal sequence explaining gravity system design of the sample project near Seattle, WA.
Meanwhile, you may also notice that the Calculation Sheet that we run for the SEAOC example is in different format from our last post. We are introducing a new release of the Calculation Sheet. Many of you have provided valuable feedback on how we could improve readability of the hundred-pages-long document and we listened. Stay in touch for a formal launch next week!
About the Authors

Robin Li is the Co-founder and COO of Genia and now leads product management. After graduating from University of British Columbia, Robin started off his career at Arup as a certified structural engineer, where he designed structures for a high-rise casino hotel in Macaw. Later, he returned to Canada and designed 100+ low-rise and mid-rise structures, including high-end custom homes in timber. You can find Robin on Linkedin or email him at robin@genia.design.

Calvin Zheng joined Genia in 2024 as a product manager. He holds a master’s degree in structural engineering from UCLA and has 5 years of experience designing structures in Los Angeles, first at JCE Structural Engineering Group and later at KPFF.